
Data Analytics and Visualization
Transforming Raw Data into Strategic Insights for Informed Decision-Making
Talk to our ExpertsData Analytics and Visualization services are critical for businesses seeking to gather meaningful information from complex data sets by converting into actionable insights and intuitive graphical representations. Our offerings in this area encompass advanced analytics techniques and state-of-the-art visualization tools to convert raw data into clear, concise, and informative dashboards and reports. With our expertise in Data Analytics and Visualization, companies can uncover hidden opportunities and optimize.
Benefits of Using Data Analytics
Get In Touch- Process vast volumes of information and make informed decisions
- Delve deeper into customer sentiment data to uncover opportunities for launching new services.
- Actionable insights to enhance productivity and sales.
- Comprehensive visualizations of the latest marketing trends, customer behavior, demand variations, sales, and pricing.
- Insights derived from accurate data eliminate the need for speculative guesswork.
Speak to an expert
In your line of work, we know every minute matters.
Data Analytics and Visualization Services
Reports and Dashboard Development
- Strategic dashboards catered for C-suite managers, offering a comprehensive view of KPIs across the entire company.
- Tactical dashboards tailored for mid-level management.
- Operational dashboards created for managers to oversee business processes, pinpoint bottlenecks, and more.
- Analytics dashboards designed for data experts, enabling them to identify trends and build forecasts.
Data Analytics
- Establish ETL/Data Warehouse processes for the integration of data from various sources.
- Develop a centralized repository, OLAP cubes, and other components.
- Enforce data security and data quality.
- Implement data reporting and visualization systems.
Data Visualization Optimization
- Performance tuning for enhancing the speed and responsiveness of data visualizations
- Tailor services for specific tools like Tableau, Power BI, Qlik, etc.
- Prevent cognitive overload and promote easier interpretation
- Create dynamic and interactive dashboards
Case Study
Gain Insights into Our Services Industry
Our Approach
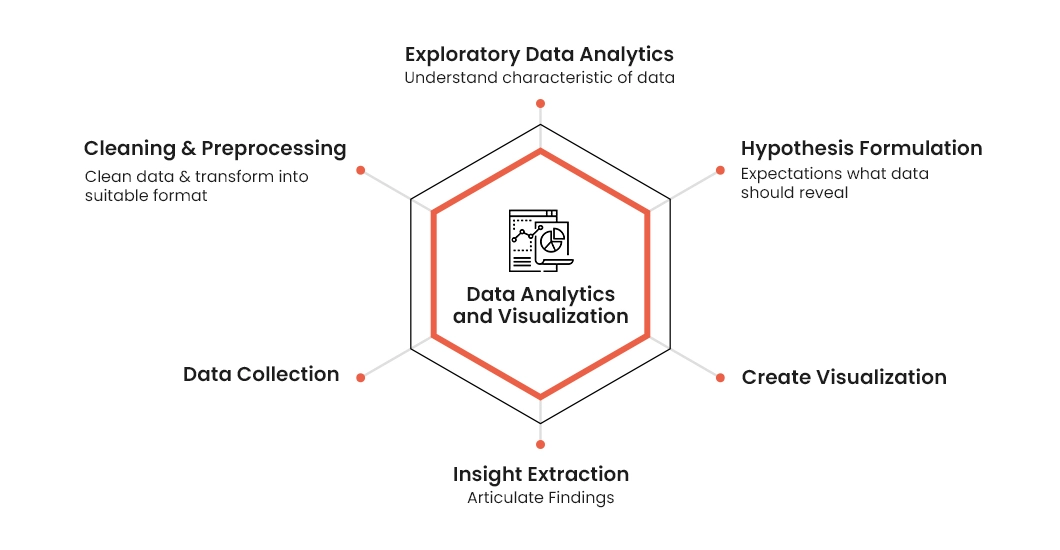
Our approach to Data Analytics and Visualization is a comprehensive and iterative process that ensures data is not only accurately analyzed but also effectively communicated. Here’s how we approach it:


Recent Insights
FAQs
We offer a comprehensive suite of services designed to transform raw data into strategic insights for businesses in the USA. Our key offerings include:
- Reports and Dashboard Development: We create custom dashboards tailored to different roles within your organization, including strategic dashboards for C-suite executives, tactical dashboards for mid-level management, operational dashboards for process managers, and in-depth analytics dashboards for data experts.
- End-to-End Data Analytics: Our services cover the entire data pipeline. We establish robust ETL/Data Warehouse processes, develop centralized repositories and OLAP cubes, enforce strict data security and quality standards, and implement advanced reporting systems.
- Data Visualization Optimization: We enhance the performance and usability of your data visualizations. This includes performance tuning for speed, tailoring solutions for specific tools like Tableau, Power BI, and Qlik, and creating dynamic, interactive dashboards designed to be easily interpreted and prevent cognitive overload.
By partnering with us for data analytics, your US-based business can unlock significant value and gain a competitive edge. The primary benefits include:
- Informed, Data-Driven Decisions: Process vast volumes of information to make strategic decisions based on accurate data, eliminating speculative guesswork.
- Enhanced Productivity and Sales: Gain actionable insights that help you optimize processes, improve efficiency, and identify new sales opportunities.
- Deep Customer Understanding: Delve into customer sentiment data to uncover behavior patterns, preferences, and opportunities for launching new, in-demand services.
- Comprehensive Market Visibility: Utilize clear, intuitive visualizations to understand the latest marketing trends, demand variations, and pricing strategies, allowing you to react quickly to market changes.
Yes, absolutely. We specialize in developing dashboards that are specifically catered to the needs of different user personas within your enterprise. Our offerings include:
- Strategic Dashboards for C-suite managers, providing a high-level, comprehensive view of key performance indicators (KPIs) across the entire company.
- Tactical Dashboards tailored for mid-level management, focusing on departmental performance and trends to support medium-term goals.
- Operational Dashboards for managers responsible for overseeing daily business processes, helping them identify bottlenecks and improve efficiency in real-time.
- Analytics Dashboards designed for data experts and analysts, enabling them to explore data, identify trends, and build forecasts.
We are proficient in a range of state-of-the-art visualization tools and tailor our services to optimize the platforms you use. We have specific expertise in enhancing the speed, responsiveness, and interactivity of dashboards built with industry-leading tools such as:
- Tableau
- Power BI
- Qlik
Our optimization services ensure that your dashboards are not only visually appealing but also highly performant and easy to interpret.
Data security and quality are fundamental to our analytics services. We implement a rigorous framework to protect your data and ensure its integrity by:
- Establishing Secure Data Pipelines: We build secure ETL (Extract, Transform, Load) and Data Warehouse processes to manage the integration of data from various sources.
- Enforcing Strict Protocols: Our process includes enforcing strict data security and data quality rules throughout the entire data lifecycle.
- Developing a Centralized, Controlled Repository: By creating a secure, centralized data repository, we ensure that access is controlled and data remains consistent and trustworthy for all reporting and visualization
Our approach to data visualization is centered on clarity and ease of interpretation. We achieve this by:
- Preventing Cognitive Overload: We design dashboards that present information in a clear, concise, and intuitive graphical manner, avoiding clutter and overwhelming users with too much data at once.
- Creating Interactive Dashboards: We build dynamic and interactive visualizations that allow users to drill down into the data, explore different facets, and uncover insights at their own pace.
- Tailoring to the Audience: As we create different dashboards for different roles (from C-suite to operational managers), we ensure the level of detail and complexity is appropriate for the intended audience.
Getting started is a straightforward process. You can “Speak to an expert” by scheduling a consultation directly with our team. We understand that every minute matters in your line of work, so our initial meeting will be focused and efficient.
In this consultation, we will discuss your specific business challenges, identify your key objectives, and begin to outline a roadmap for transforming your raw data into strategic, actionable insights that drive informed decision-making.